The Analytic Hierarchy Process (AHP) is a method for organizing and analyzing complex decisions, using math and psychology. It was developed by Thomas L. Saaty in the 1970s and has been refined since then. It contains three parts: the ultimate goal or problem you’re trying to solve, all of the possible solutions, called alternatives, and the criteria you will judge the alternatives on. AHP provides a rational framework for a needed decision by quantifying its criteria and alternative options, and for relating those elements to the overall goal.
Stakeholders compare the importance of criteria, two at a time, through pair-wise comparisons. Example, do you care about job benefits or having a short commute more, and by how much more? AHP converts these evaluations into numbers, which can be compared to all of the possible criteria. This quantifying capability distinguishes the AHP from other decision making techniques.
In the final step of the process, numerical priorities are calculated for each of the alternative options. These numbers represent the most desired solutions, based on all users’ values. (Wikipedia)
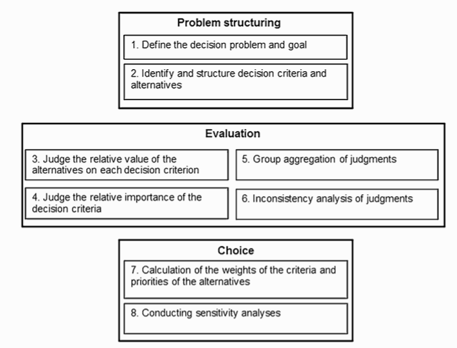
Here is a visual representation of all the steps:

Hummel, et al. “Group Decision Making with the Analytic Hierarchy Process in Benefit-Risk Assessment: A Tutorial.” The Patient - Patient-Centered Outcomes Research, 7, no. 2 (2014)
The AHP is most useful when finding decisions to complex problems with high stakes. It stands out from other decision-making techniques as it quantifies criteria and options that traditionally are difficult to measure with hard numbers. Rather than prescribing a “correct” decision, AHP helps decision makers find one that best suits their values and their understanding of the problem. (Wikipedia)
Having all stake holders weigh in is important, as various divisions will value criteria differently. For example, when deciding on new software, Sales may be focused on its ease of use, while Admins care more about its integrations to other systems. AHP is also different from a regular poll or meeting as it takes out bias from the decision. More on that here. Plus, using the AHP boosts morale as everyone feels their voices are heard, and they can ultimately understand how a decision was made.
We’ve mentioned how AHP is unique because it can quantify criteria and alternatives, but what does that really look like? As an end user of Prioritization Helper, you won’t see the calculations going on behind the scenes. Here is a quick look of the calculations behind a result.
Let’s pretend the Smith family wants to decide the best city to live in - City A, B, C, or D. The goal is to determine which city is best, given the criteria - Culture, Close to Family, Jobs, Housing, and Transportation. They weigh the criteria, and compare the four city alternatives to the criteria. The following tables illustrate the derived data based on their input. In general, all of the decimals will add up to 1, and higher decimals equals a higher priority.
Table 2 shows how the criteria were rated against each other. Looking at the top row, Culture scored a “3” above Housing and a “5” above Transportation, while Family scored a “5” above Culture, and Jobs scored a “2” above Culture. This gives Culture 15.2% of the criteria priority, with the most important criteria being Family, at 43.3%.

The next table demonstrates the weights of each alternative against the criteria Family. Here, City C was the closest to family, while City D was the furthest. This would be repeated for every criteria.

Finally, the weighed importance of each criteria is then multiplied against the score of each alternative to get the weighed score (For City A’s weighted Cultural score: .152 x .163 = .024776). Add all new criteria numbers together to get the Overall Priority score (For City A: .024776 + .09093 + .018864 + .085095 + .009462 = .229)

Bahurmoz, Asma. “The Analytic Hierarchy Process: A Methodology for Win-Win Management” JKAU: Econ. & Adm., Vol. 20, No. 1, 2006.
The Smith’s best decision based off of their priorities, is City C. In Prioritization Helper, the final results would look like “City C - 38.5% City B - 27.5% City A - 22.9% City D - 11.1%”
As you can see, there’s a lot going on, and it can be tricky to understand. That’s why we’ve created Prioritization Helper! You can gain the benefits of an unbiased decision in minutes, without the hard work.
© 2026 Passage Technology LLC All Rights Reserved.
