
In a nutshell, Embedded Analytics allows the Salesforce Administrator to embed up to 2 report charts per page layout to display information. Here's one idea for how you can get more value from this feature with Rollup Helper.
Consolidating Rollup Fields Into A Single Report Chart
Given that you can only have just 2 charts to display per page, it is critical to get as many meaningful data points as possible per report chart. Displaying a one dimensional report chart is easy using Embedded Analytics, but you'll probably want to have as many related metrics as possible on one chart as standard Salesforce report aggregations are limited, so you will need Rollup Helper to do the heavy lifting of aggregating your data into a single object. Follow these steps to learn how to do an embedded analytic report chart on the User detail page with Rollup Helper rollup fields.
1) Define Your Rollups
2) Create a summary user report containing the target rollup fields that you created in the previous step as columns. Make sure you show details on the report. You will need to make sure you group on a field, we recommend the user's full name. Make sure to add a chart to the report. The chart you add to this report will be the one that is used on the User Detail page when you edit the page layout. We recommend using a vertical bar chart.
3) Add the report chart to your user page layout. Voila!
See the chart below for an example of the finished product!
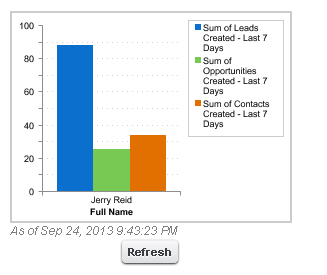
Summary
This concept can be extended to any detailed information stored in Salesforce about your users or any parent lookup / master object! Just decide which data points you need to aggregate in the chart, create the rollups, then create the chart! Your rollups in Rollup Helper now can be visualized!
For answers to all your Rollup Helper questions, check out our Admin Guide.
| Using Rollup Helper For Your Flow | Rollup Helper Use Case Library | Renewal Management |